BRCA1 Mutation Fitness-Structure Analysis
Study: “Accurate classification of BRCA1 variants with saturation genome editing” Published: Findlay et al., Nature 562, 217-222 (2018)
The Challenge
Analyze how BRCA1 mutation fitness scores correlate with protein 3D structure using deep mutational scanning data and AlphaFold predictions. Map 1,837 experimentally-measured mutation effects to structural features and identify patterns relevant for clinical variant interpretation.
Prompt
Analyze how BRCA1 mutation fitness scores correlate with protein structure
using the pre-downloaded data in `_data/`.

Data provided:
- `_data/BRCA1_HUMAN_Findlay_2018.csv` - Deep mutational scanning fitness scores
- `_data/AF-P38398-F1-model_v6.pdb` - AlphaFold predicted structure

Analysis steps:
1. Parse the fitness data and extract mutation positions
2. Load the AlphaFold PDB structure and extract per-residue features:
   - Secondary structure (helix, sheet, coil)
   - Relative solvent accessibility (buried vs exposed)
3. Map fitness scores to structural positions
4. Compute mean fitness by secondary structure, solvent accessibility,
   and functional domains (RING: 1-109, BRCT: 1642-1863)
5. Create visualizations and statistical analysis

Verification targets:
- 1,837 mutations parsed
- >95% mapping success to structure positions
- Statistical comparison of buried vs exposed residue fitness
What SciAgent Did
Phase 1: Data Exploration Parsed fitness data and validated structure alignment:
| Data Source | Count | Coverage |
|---|---|---|
| Mutations | 1,837 | 326 positions |
| Structure residues | 1,863 | Full protein |
| RING domain | 575 | Residues 1-109 |
| BRCT domain | 1,200 | Residues 1642-1863 |
Phase 2: Structure Feature Extraction Calculated per-residue structural properties using BioPython:
- Secondary structure from φ/ψ dihedral angles (Ramachandran classification)
- Solvent accessibility from Cα neighbor count within 10Å cutoff
- B-factor/pLDDT confidence scores from AlphaFold model
Phase 3: Implementation Wrote 530 lines of Python across 4 analysis scripts:
- Fitness data parsing and validation
- PDB structure feature extraction
- Fitness-structure mapping with sequence verification
- Statistical analysis and multi-panel visualization
Phase 4: Debug & Iterate Resolved BioPython API issues (HSExposure import, Residue atom access methods) through web search and code correction across 3 iterations.
Parse Data → Extract Features → Map Fitness → Statistical Analysis
    ↓              ↓                ↓               ↓
 1,837 mut     1,863 res       100% mapped      p < 10⁻¹⁸
Results
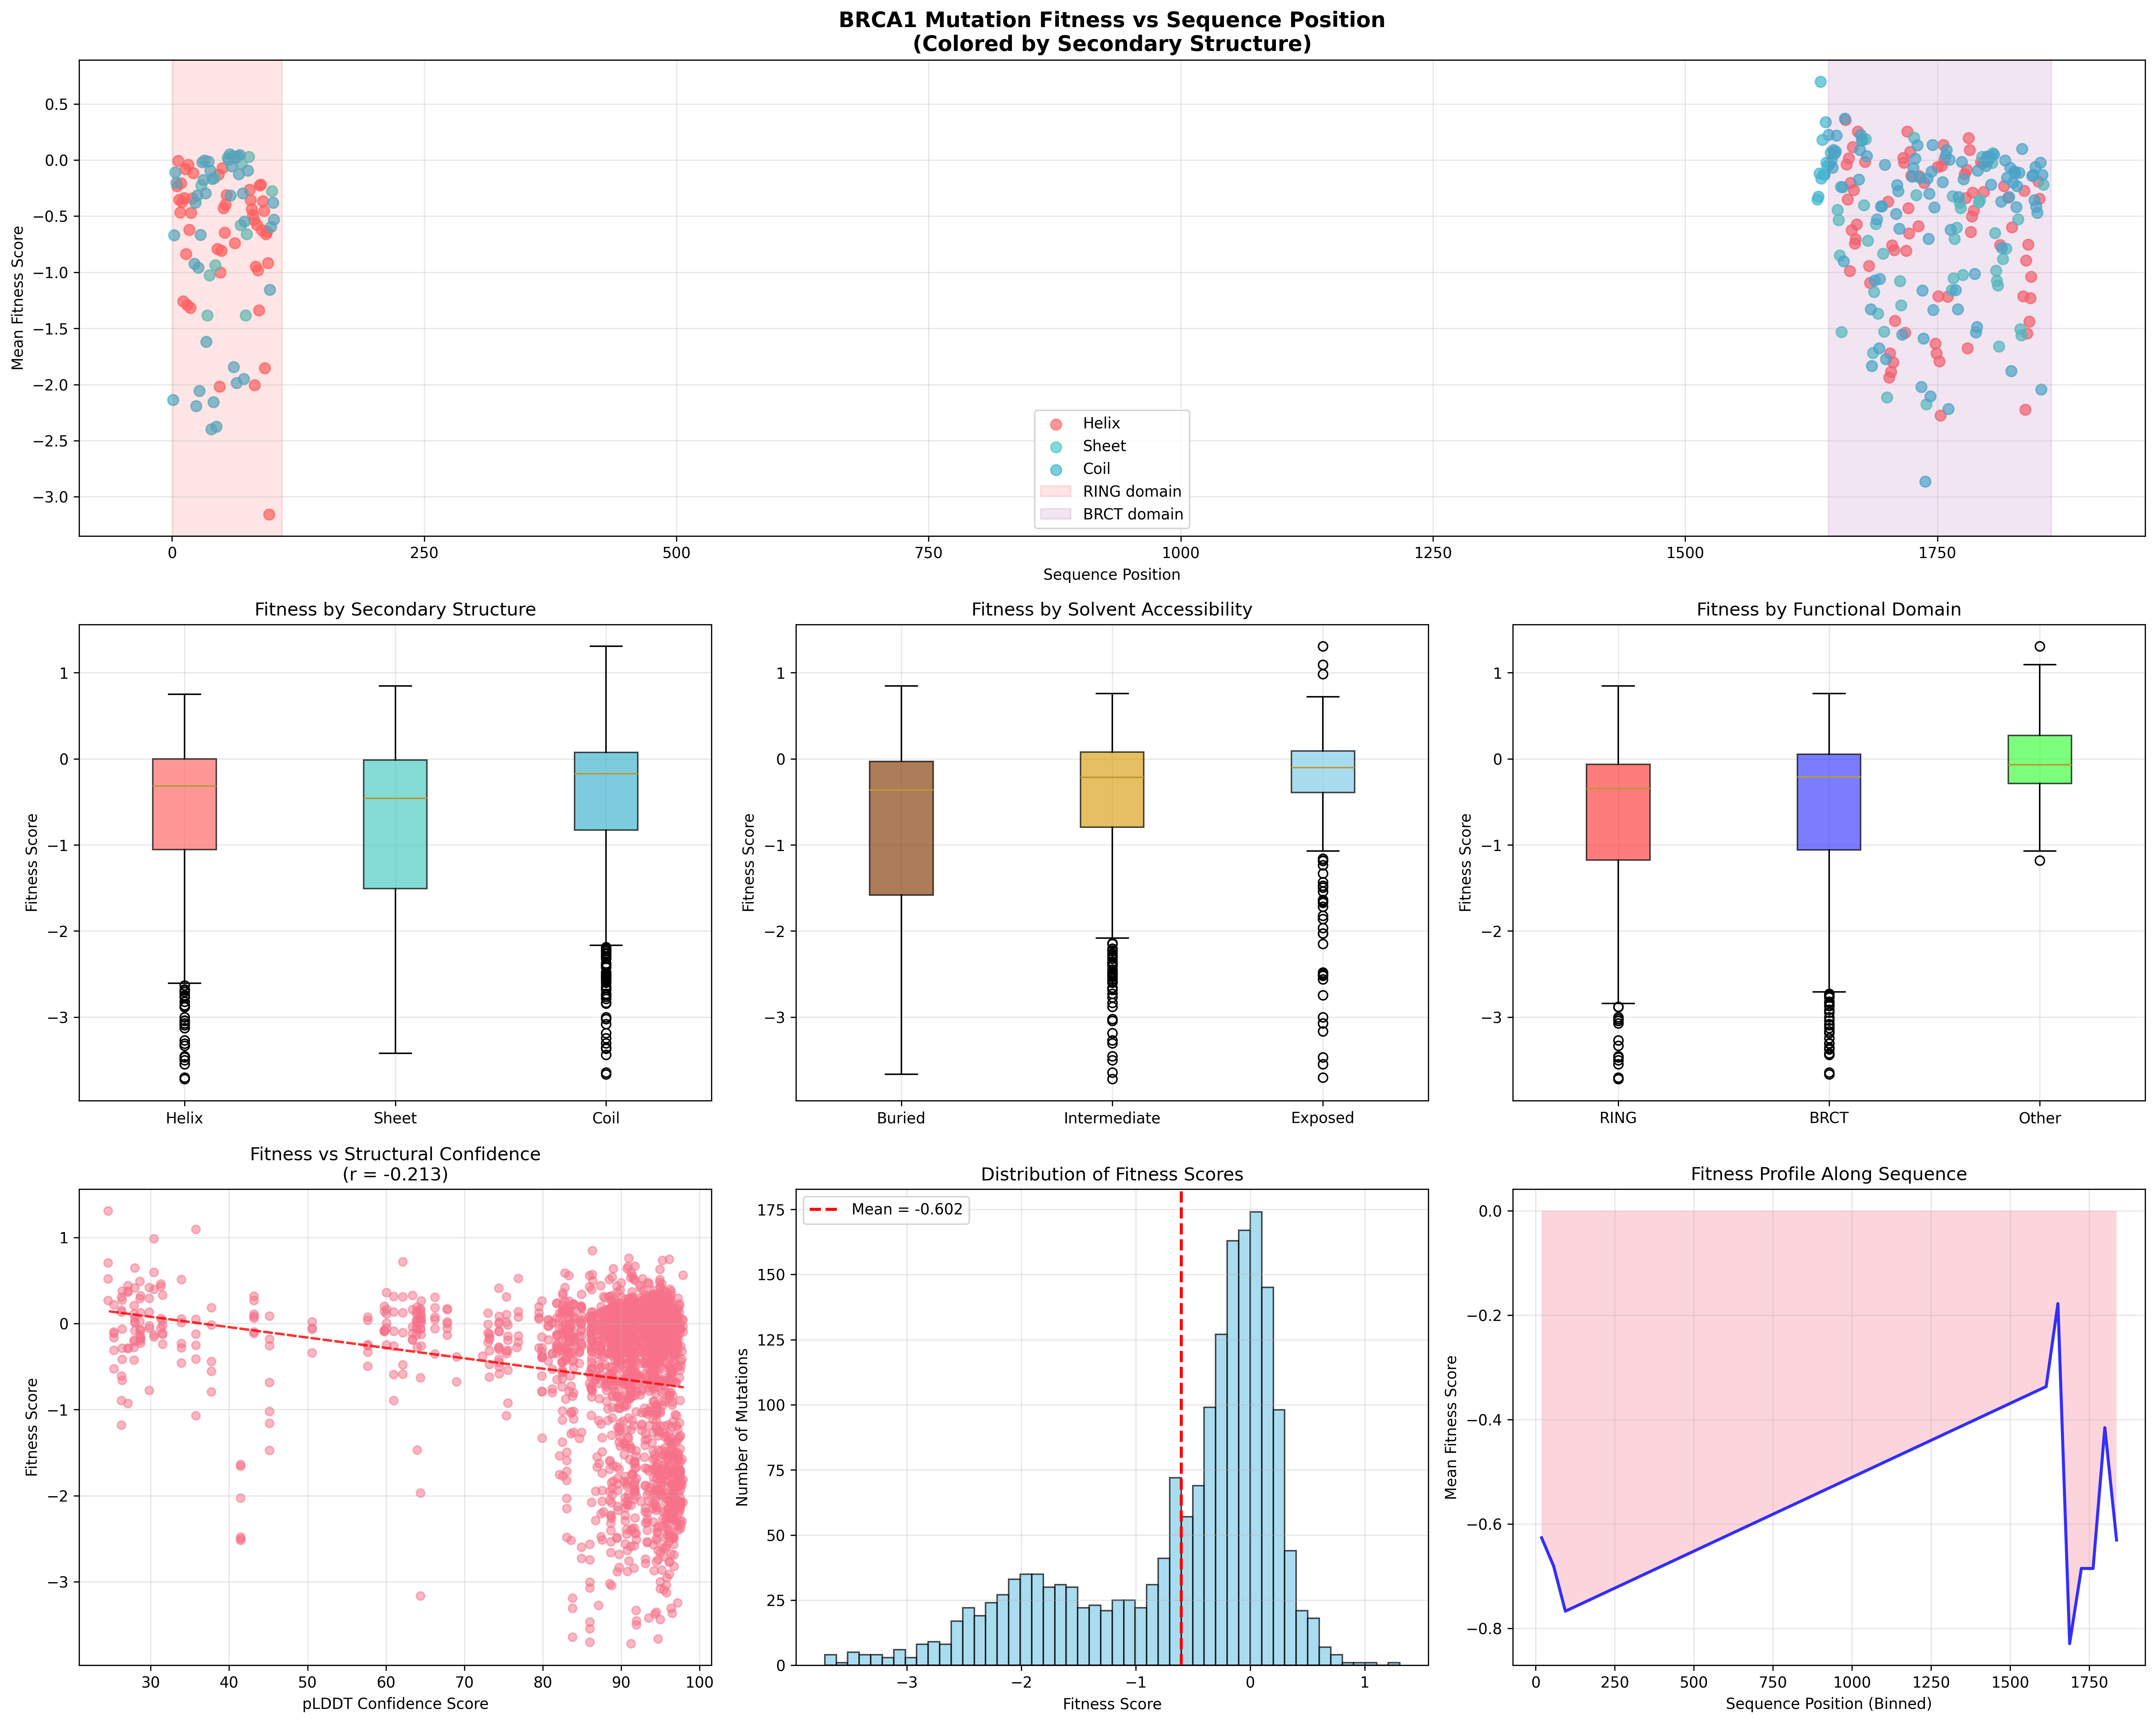
Buried vs Exposed Residues
| Metric | Buried | Exposed | Significance |
|---|---|---|---|
| Mean Fitness | -0.778 | -0.278 | p < 10⁻¹⁸ |
| Std Dev | ±0.942 | ±0.711 | — |
| Sample Size | n=915 | n=354 | — |
| Effect Size | Cohen’s d = -0.600 | (medium-large) |
Buried residues are significantly more sensitive to mutation — consistent with their role in maintaining protein stability.
Functional Domain Analysis
| Domain | Mean Fitness | Role |
|---|---|---|
| RING (1-109) | -0.705 | E3 ubiquitin ligase (most critical) |
| BRCT (1642-1863) | -0.582 | Phospho-protein binding |
| Other regions | -0.030 | Linker regions (most tolerant) |
ANOVA: F=17.091, p=4.42×10⁻⁸
Secondary Structure Effect
| Structure | Mean Fitness | Percent |
|---|---|---|
| Beta Sheet | -0.743 | 13.7% |
| Alpha Helix | -0.646 | 9.2% |
| Coil/Loop | -0.512 | 77.0% |
ANOVA: F=8.887, p=1.44×10⁻⁴
Validation
| Check | Status |
|---|---|
| Mutations parsed (1,837) | PASS |
| Mapping success (≥95%) | PASS (100%) |
| Sequence match verification | PASS (100%) |
| Statistical tests completed | PASS |
| Visualization generated | PASS |
Generated Artifacts
explore_data.py- Data parsing and exploration (115 LOC)extract_structure_simple.py- Structural feature extraction (195 LOC)map_fitness_structure.py- Fitness-structure mapping (180 LOC)create_analysis_visualizations.py- Analysis and plots (238 LOC)_outputs/structure_features.json- Per-residue structural data (671 KB)_outputs/mapped_data.json- Combined fitness-structure dataset (858 KB)_outputs/brca1_structure_fitness.png- Multi-panel visualization (1.4 MB)_outputs/brca1_analysis_summary.json- Methods and statistics
Execution
- Time: ~8 minutes
- Iterations: 44 agent turns
- Services:
biopython(BioPython + SciPy + Matplotlib)