Simulating Datacenter Temperature Distribution with OpenFOAM
Paper: Barestrand et al., “Modelling Convective Heat Transfer of Air in a Data Center using OpenFOAM — Evaluation of the Boussinesq Buoyancy Approximation” Published: OpenFOAM Journal, Vol. 3 (2021), doi:10.51560/ofj.v3.59
The task
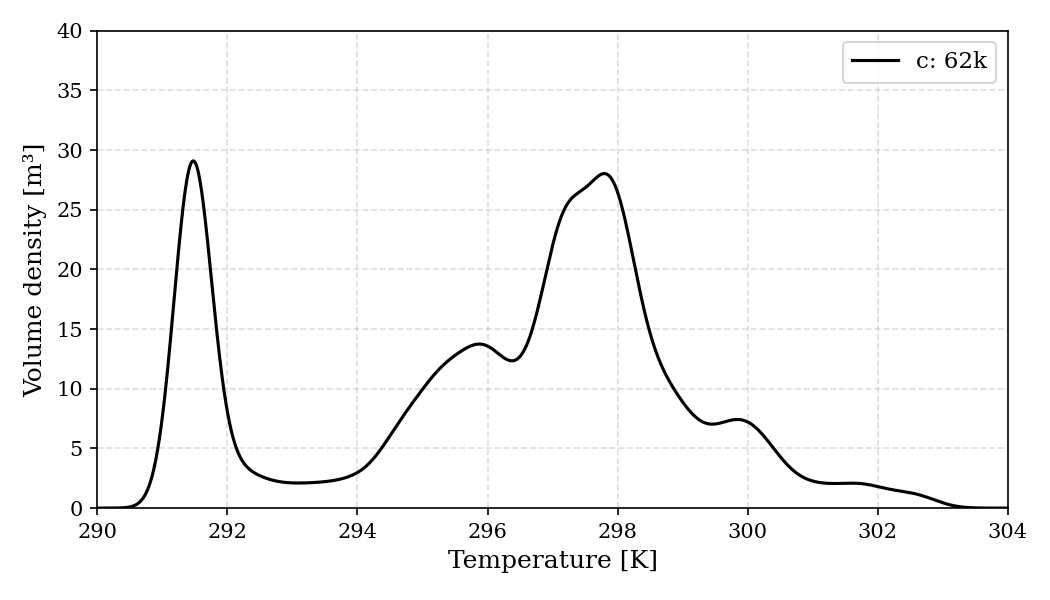
Reproduce Fig. 3 from the paper using the manuscript and provided OpenFOAM case files, keep the CFD solve on a cloud cluster, and validate the resulting temperature statistics against the paper’s coarse-grid regime.
Why this case matters
This is the cleanest end-to-end cloud-compute case in the docs. It is the best example of SciAgent reading a paper and a case bundle, running real remote simulation work, pulling the outputs back, and closing the loop with an audit-grade verifier.
What the audited run did
SciAgent recovered the solver recipe from the paper and case files, identified buoyantBoussinesqSimpleFoam as the target environment, launched the meshing and solver workflow on a SkyPilot-backed cluster, and returned the resulting fields for KDE-style temperature analysis.
The benchmark intentionally capped the solve at 1000 SIMPLE iterations, so the success criterion is not perfect residual convergence; it is whether the run reproduces the characteristic temperature distribution and stays within the paper’s expected coarse-grid regime.
Outcome against the benchmark criterion
| Metric | Value |
|---|---|
| Cell count | 61,811 |
| Cell count error | 0.19% |
| Volume-weighted mean temperature | 296.2092 K |
| Temperature range | 290.9645 K to 302.9278 K |
| Mean temperature in target range 294-298 K | YES |
The SciAgent run lands squarely inside the target 294-298 K band and reproduces the characteristic bimodal datacenter temperature structure from the paper. The matching cc-bare baseline, meaning Claude Code without access to SciAgent’s registry or compute subagents, also lands in-range at 295.333 K, so this is another case where the interesting difference is not pass/fail correctness.
What the audit trail adds
CFD is the clean audit case in the retrospective report:
- the verifier accepted the run as
verifiedat confidence0.91 - it recorded 16 supporting facts
- it recorded zero issues, zero fabrication indicators, and zero missing-evidence entries
This case also helps on the efficiency story. In the benchmark report, SciAgent was cheaper than cc-bare here, and verifier cost was only 1.7% of total spend. If you want the clearest example of “paper + inputs -> cluster execution -> results back -> verified conclusion,” this is the page to read.